 Chris
ChrisAt the end of November I came across this Green sustainability challenge for Madrid: https://challenge.greemta.eu/
GreeMta is a project of Bruno Kessler Foundation promoted by EIT Climate-KIC’s Cross-KIC Sustainable Cities program together with the municipality of Madrid.
After taking a look at the datasets and the Madrid Open Data Portal, I decided to particate.
Preface
Since this is an Open data challenge, I wanted to document the journey openly.
Feel free to take resources, approaches, code etc.
Resources
After doing a bit of searching on the internet, I bookmarked a bunch of potentially useful resources
- NYC Trees
- Visualizing Melbourne Urban forest
- NY challenge
- Approaches with Open data
- Economic value of Adelaide street trees
- Singapore tree
- Click that hood data
- Open Data portal Madrid
- Madrid Air quality
- Gauging the happines benefit of US urban parks through Twitter
Some more can be found here: https://github.com/greemta/awesome-green-resources
Code repository
Cleaning it up, will release in the following days.
Journal
2020-11-29
Discovered the challenge and started collecting resources.
To do the data analysis I chose Python and Node.js, also for preprocessing and aggregating data.
For the visualization and breakdowns I'll most likely go with a combination of Leaflet / Mapbox, Leaflet plugins and basic HTML.
2020-12-02
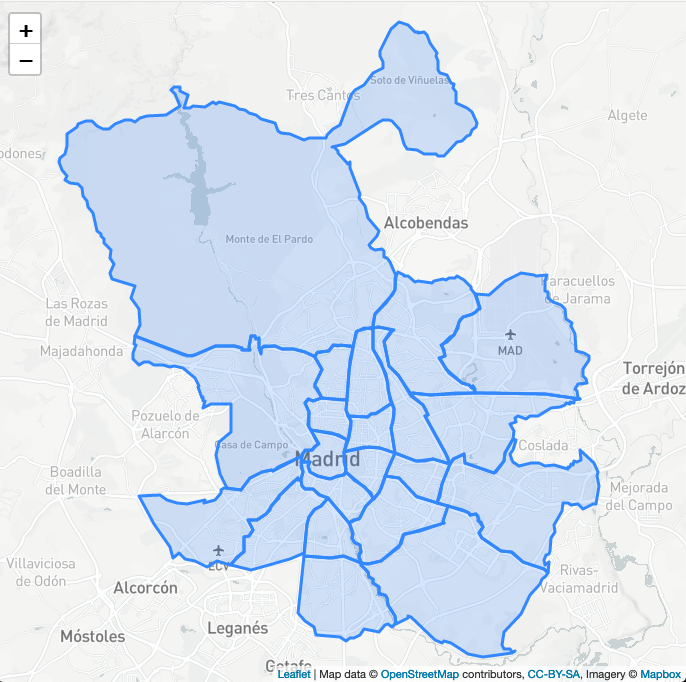
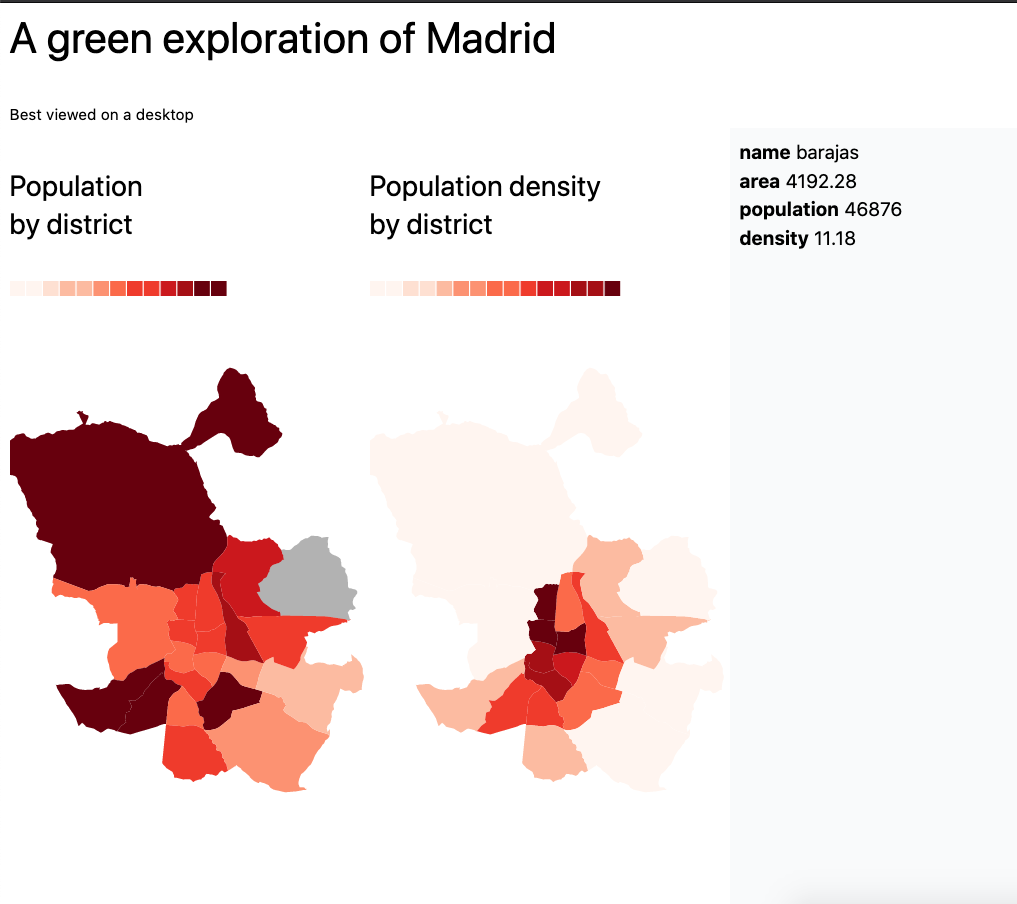
Jotted down this journal and found a way to visualize Madrid's districts.
This will be useful for aggregating the data by district, since I saw many of the datasets are grouped in this way.
Below a visualization of Madrid districts with geojson just to fiddle around with the data.
District data taken from click_that_hood
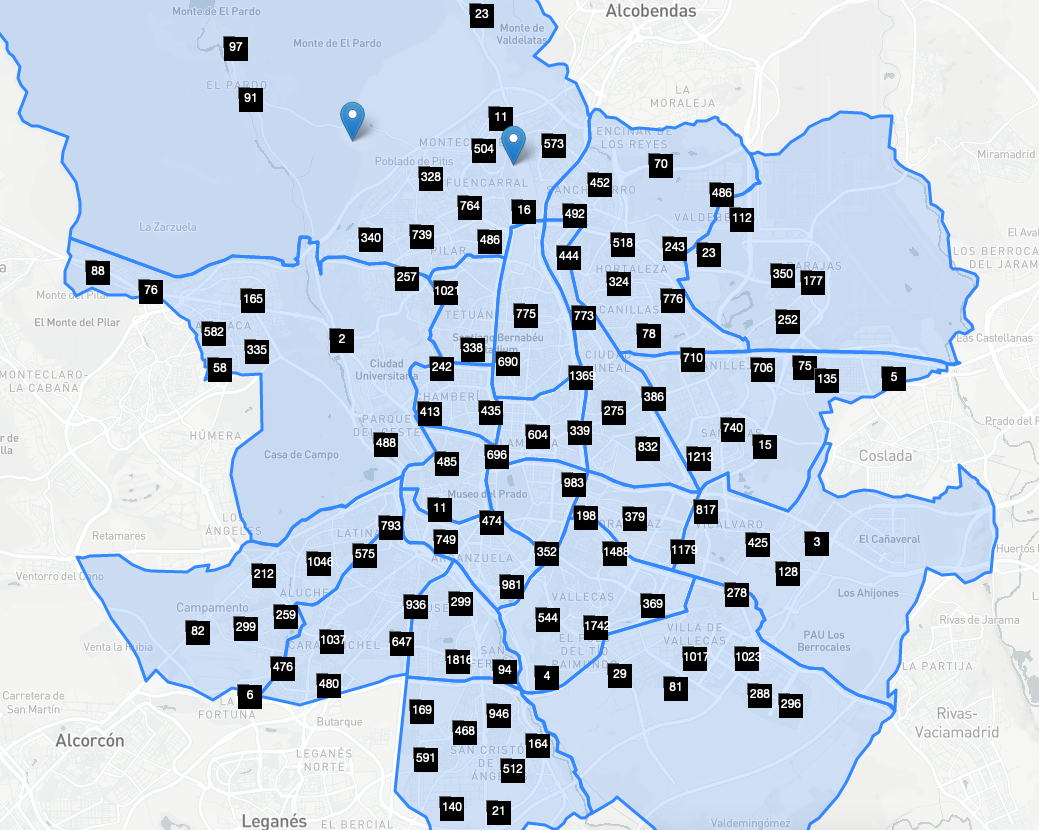
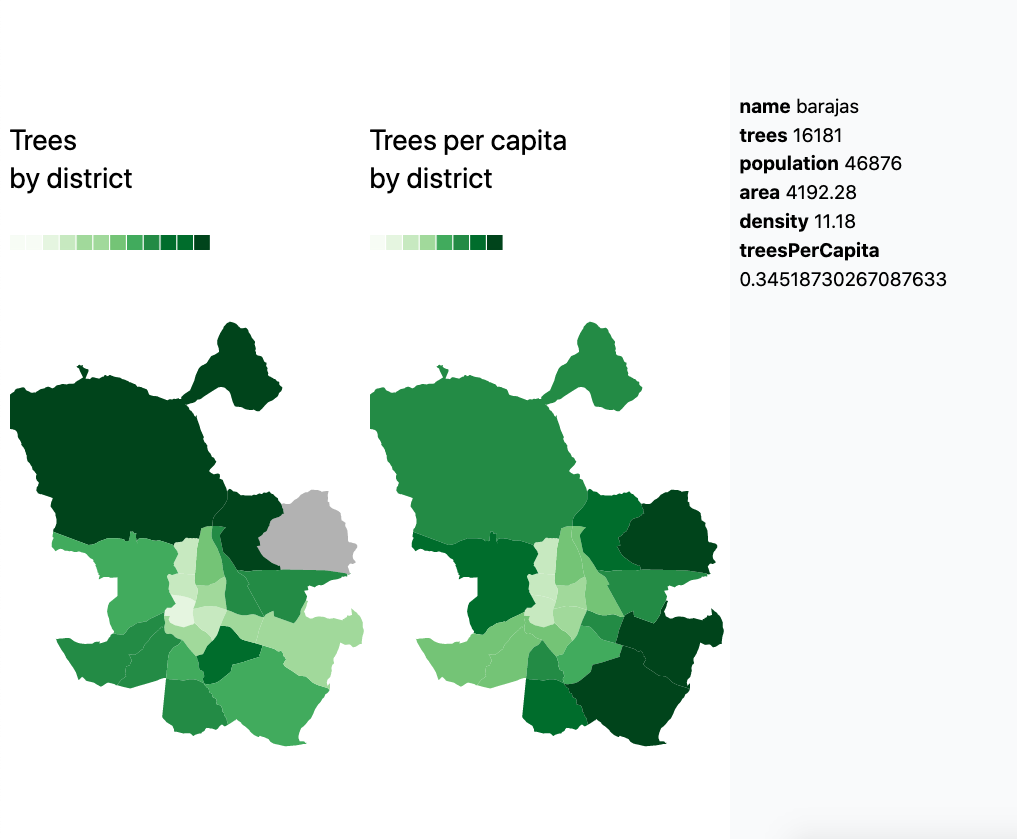
Districts with their number of tree (sample of 50k trees out of 650k)
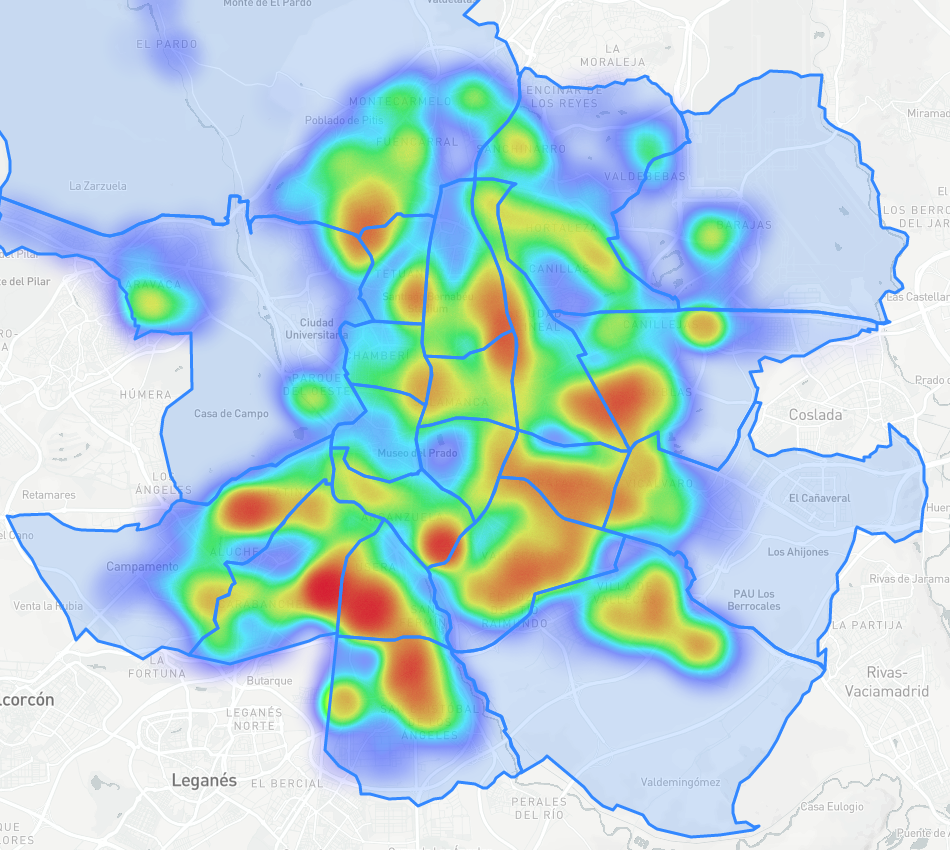
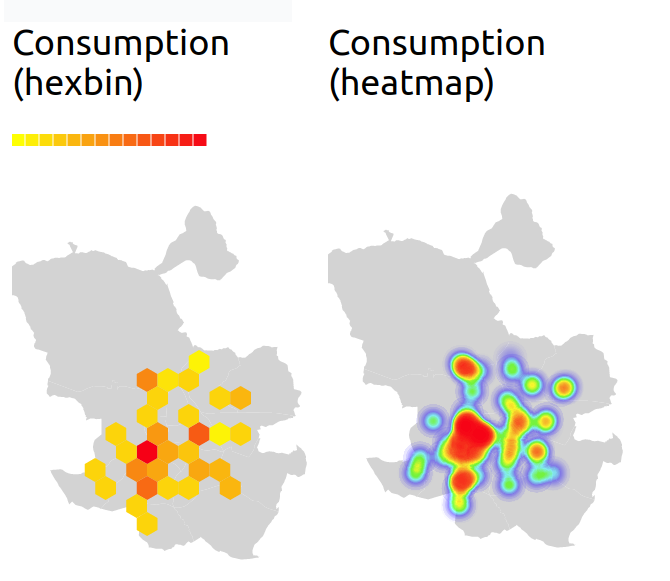
Tree heatmap (same sample)
2020-12-04
Needed to play around and get my hands dirty with python notebooks, pandas/geopandas, matplotlib.
Learned a lot of things about datascience, although I'm really just getting started.
E.g. pearson correlation, geo/dataframes and series, python vectorized string methods, geojson and visualizations.
Next up, find correlations between interesting datapoints and visualize them.
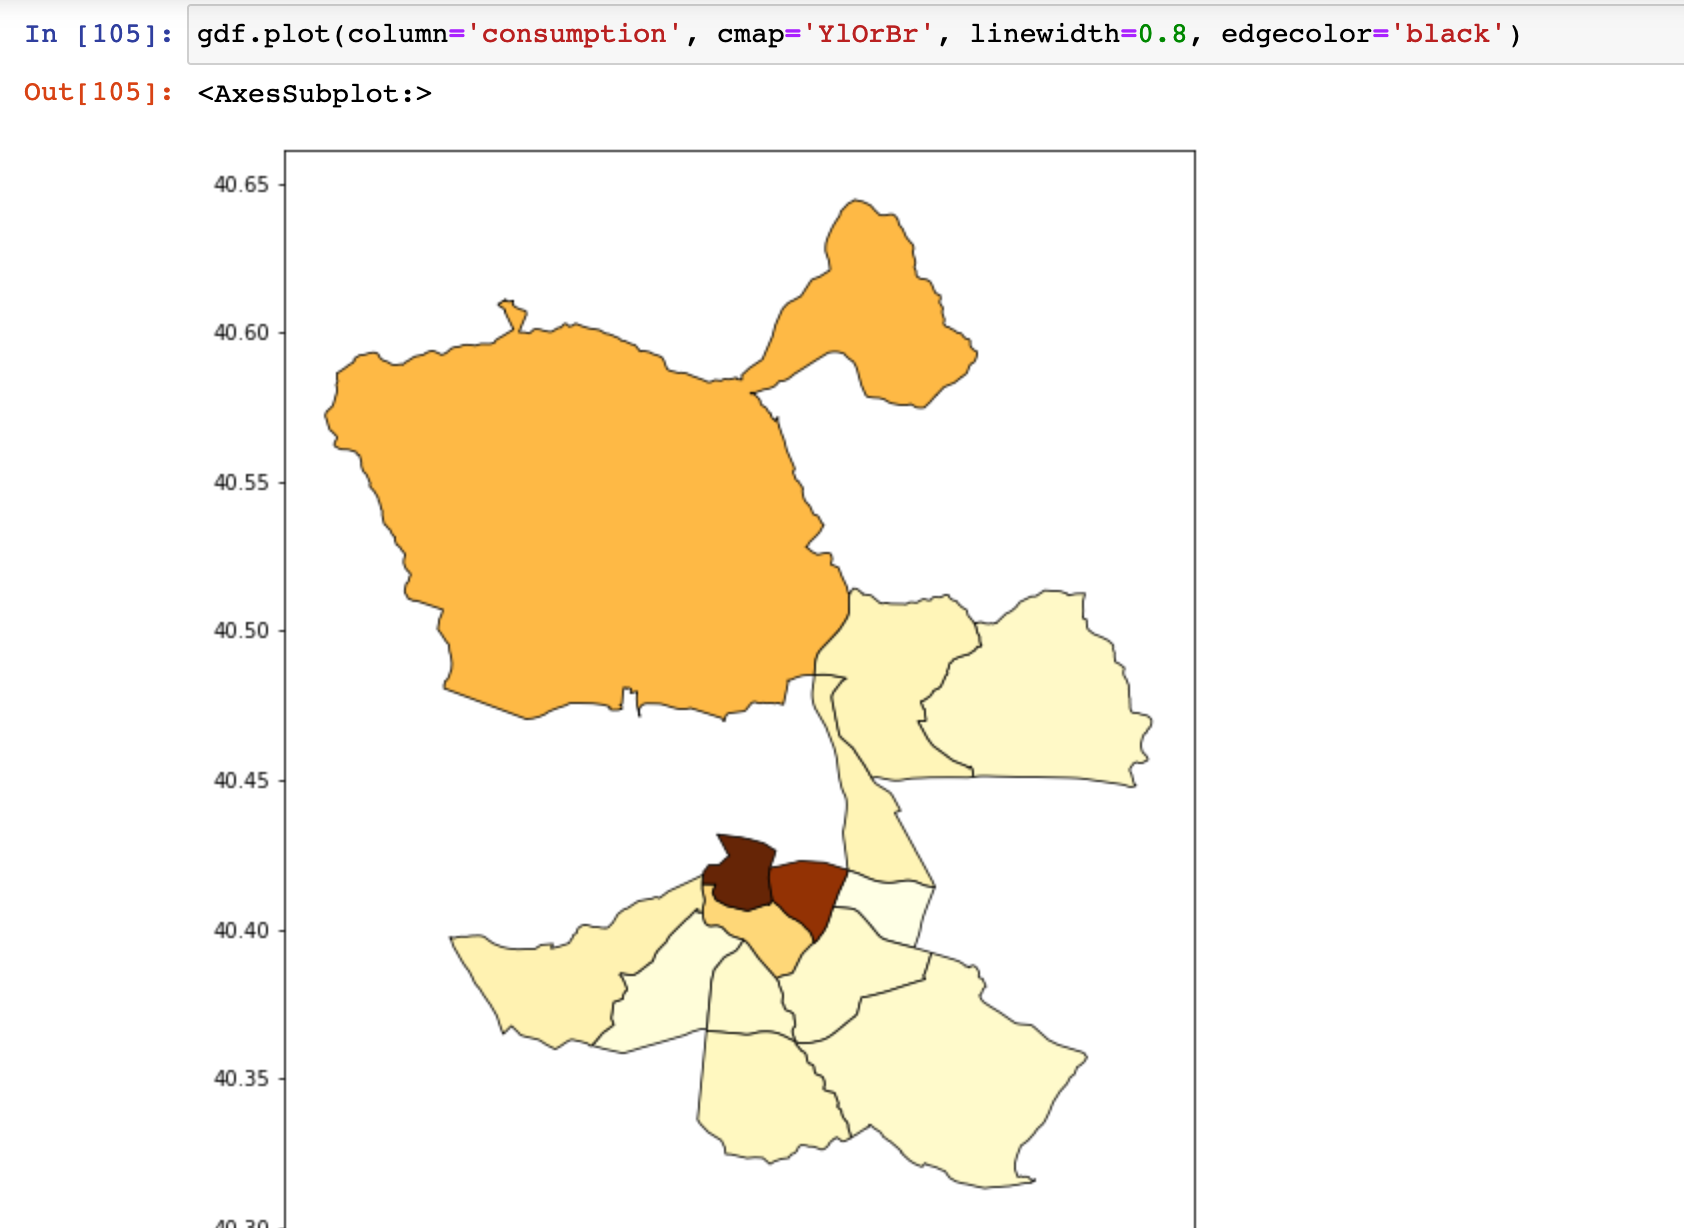
For now, I played around with energy consumption in the districts of madrid:
2020-12-10
Made some decent progress, but this time more hands-on.
Learned to use d3.js!
Made the greemta-challenge repository public
Served via GitHub Pages; you can check it out here:
https://christian-fei.github.io/greemta-challenge/
2020-12-20
Submitted the infographics I managed to get out of the datasets provided.
The infographics can be found here
The related code is on GitHub
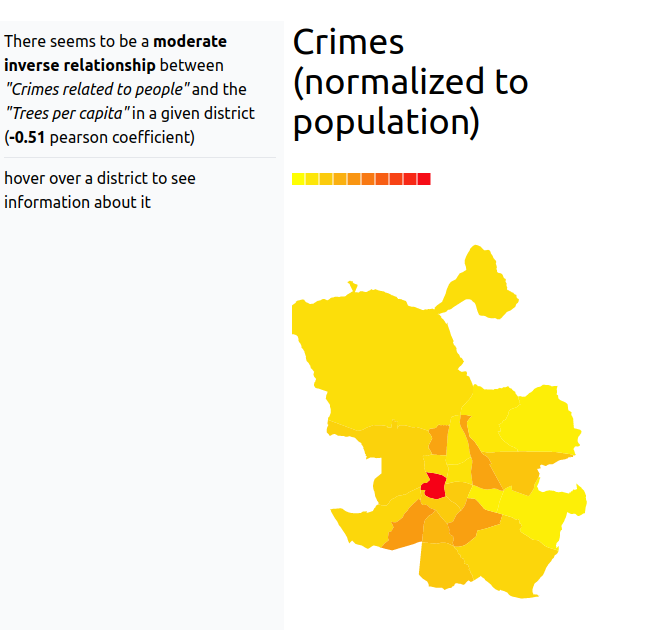
The main infographic is about potential correlations about crimes related to green areas in Madrid:
There seems to be a moderate inverse relationship between "Crimes related to people" and the "Trees per capita" in a given district (-0.51 pearson coefficient)
I tried to figure out a correlation between consumption and trees in Madrid, but found nothing.
Except for some nice heatmaps
Retrospective
It was a stimulating challenge: understanding how to interpret data in CSV and Excel files, reading papers about the impacts of green areas on society and our well being, seeing how data is visualized in meaningful ways.
Learned a ton of new things about visualization, analysing data and more:
- Data preparation
- GeoJSON, TopoJSON
- definitely some spanish
- correlations (although it doesn't mean causation ;))
- python, numpy, pandas and geopandas
- maps with leaflet, mapbox
- visualizations with d3
- heatmaps, hexagon maps
- Git Large File Storage (git lfs)
- and most likely more I can't recall now
However it goes, I surely learned a lot.