 Chris
ChrisToday I installed redash with AWS EC2 and AWS SES, with the help of the official guide.
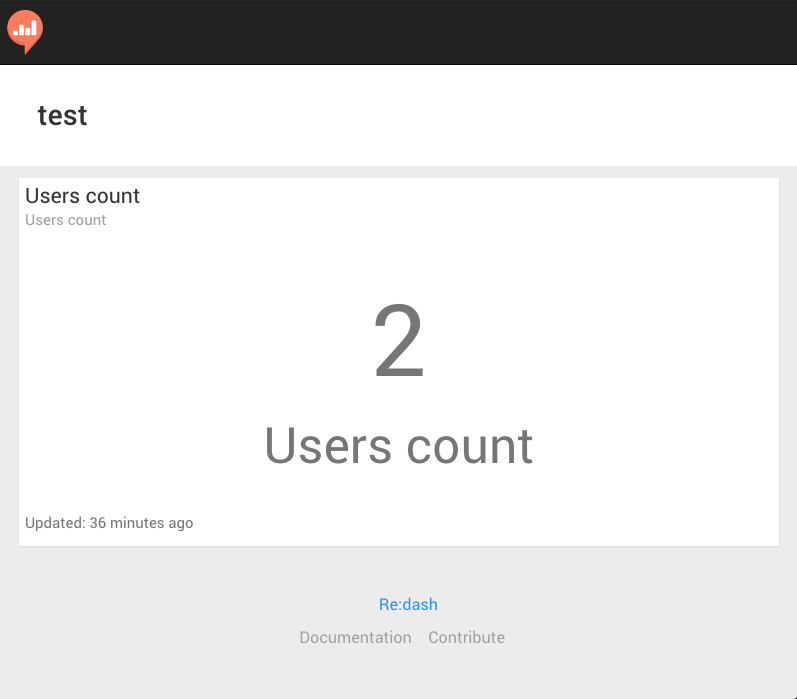
Take a look at the public dashboard that visualizes the current user count on my Redash instance!
The server runs on a t2.micro instance, backed by the Redash Ubuntu AMI.
I am using Amazon SES as the mail service.
Redash
Visualize Queries
To visualize something in Redash, you need a query.
And you execute a query on some data.
Fortunately, Redash has a default dataset (itself!) to play with, instead of hooking up an external data source.
Visualize Events
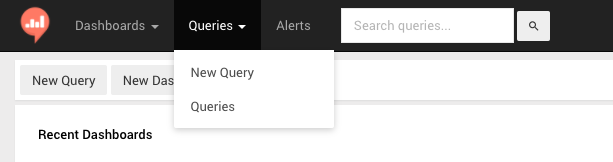
Create a new Query (/queries/new):
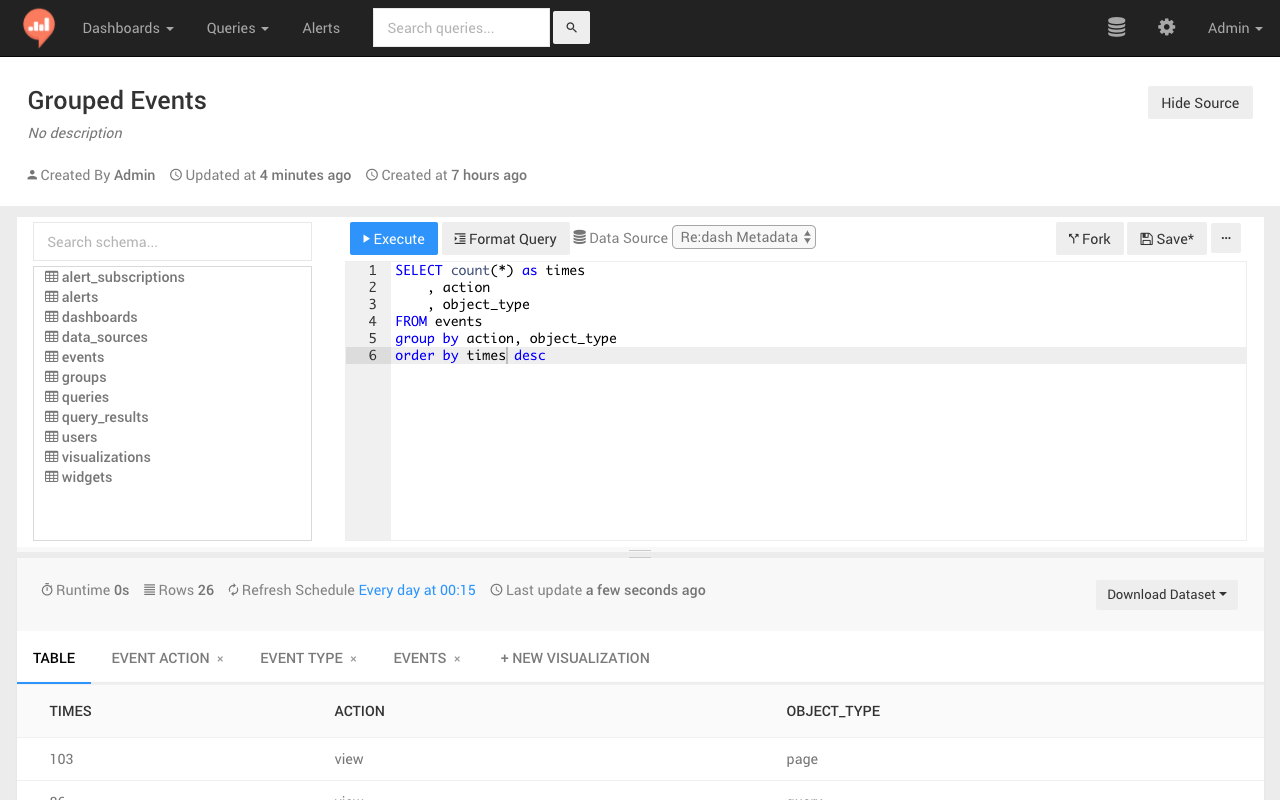
Let's aggregate events by action and type of a Redash instance:
SELECT count(*) as times
    , action
    , object_type
FROM events
group by action, object_type
order by times desc
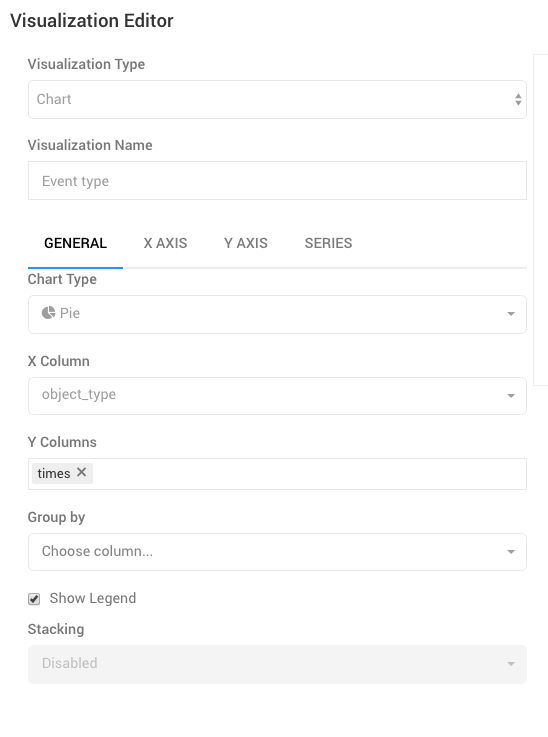
Use the following configuration to create a visualization:
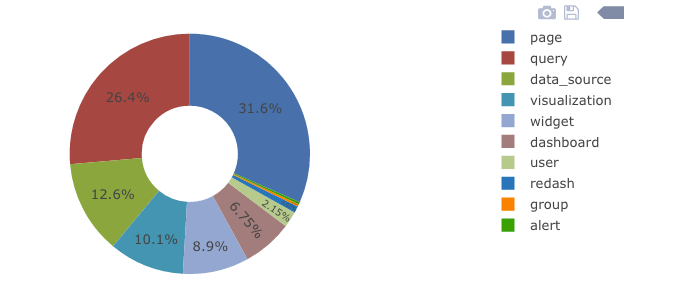
Final result
You should end up with something like this:
Conclusion
It seems like a nice piece of software, my idea is to integrate Redash with mnesia to visualize things you saved in mnesia!