 Chris
ChrisWeb Analytics & dashboards always fascinated me.
This is my approach to a self-hosted, simple web analytics solution.
It also helped me to get back to Full stack web development, using a clean and testable approach.
TLDR;
Check out the project at s.cri.dev
Node.js framework-less HTTP server
Simple bot detection
Persistence on file and in-memory
Fast calculation of analytics
Configurable retention timeframe (default 6 months)
Frontend in Preact.js and Chart.css
Web component tests with
enzymepreact-routerfor frontend routingparcelbundler
Deployment with
docker-compose
Read more about the project below
Update 2022-06-22
It's been a year since I started working on this project.
And running in production too! 🚀
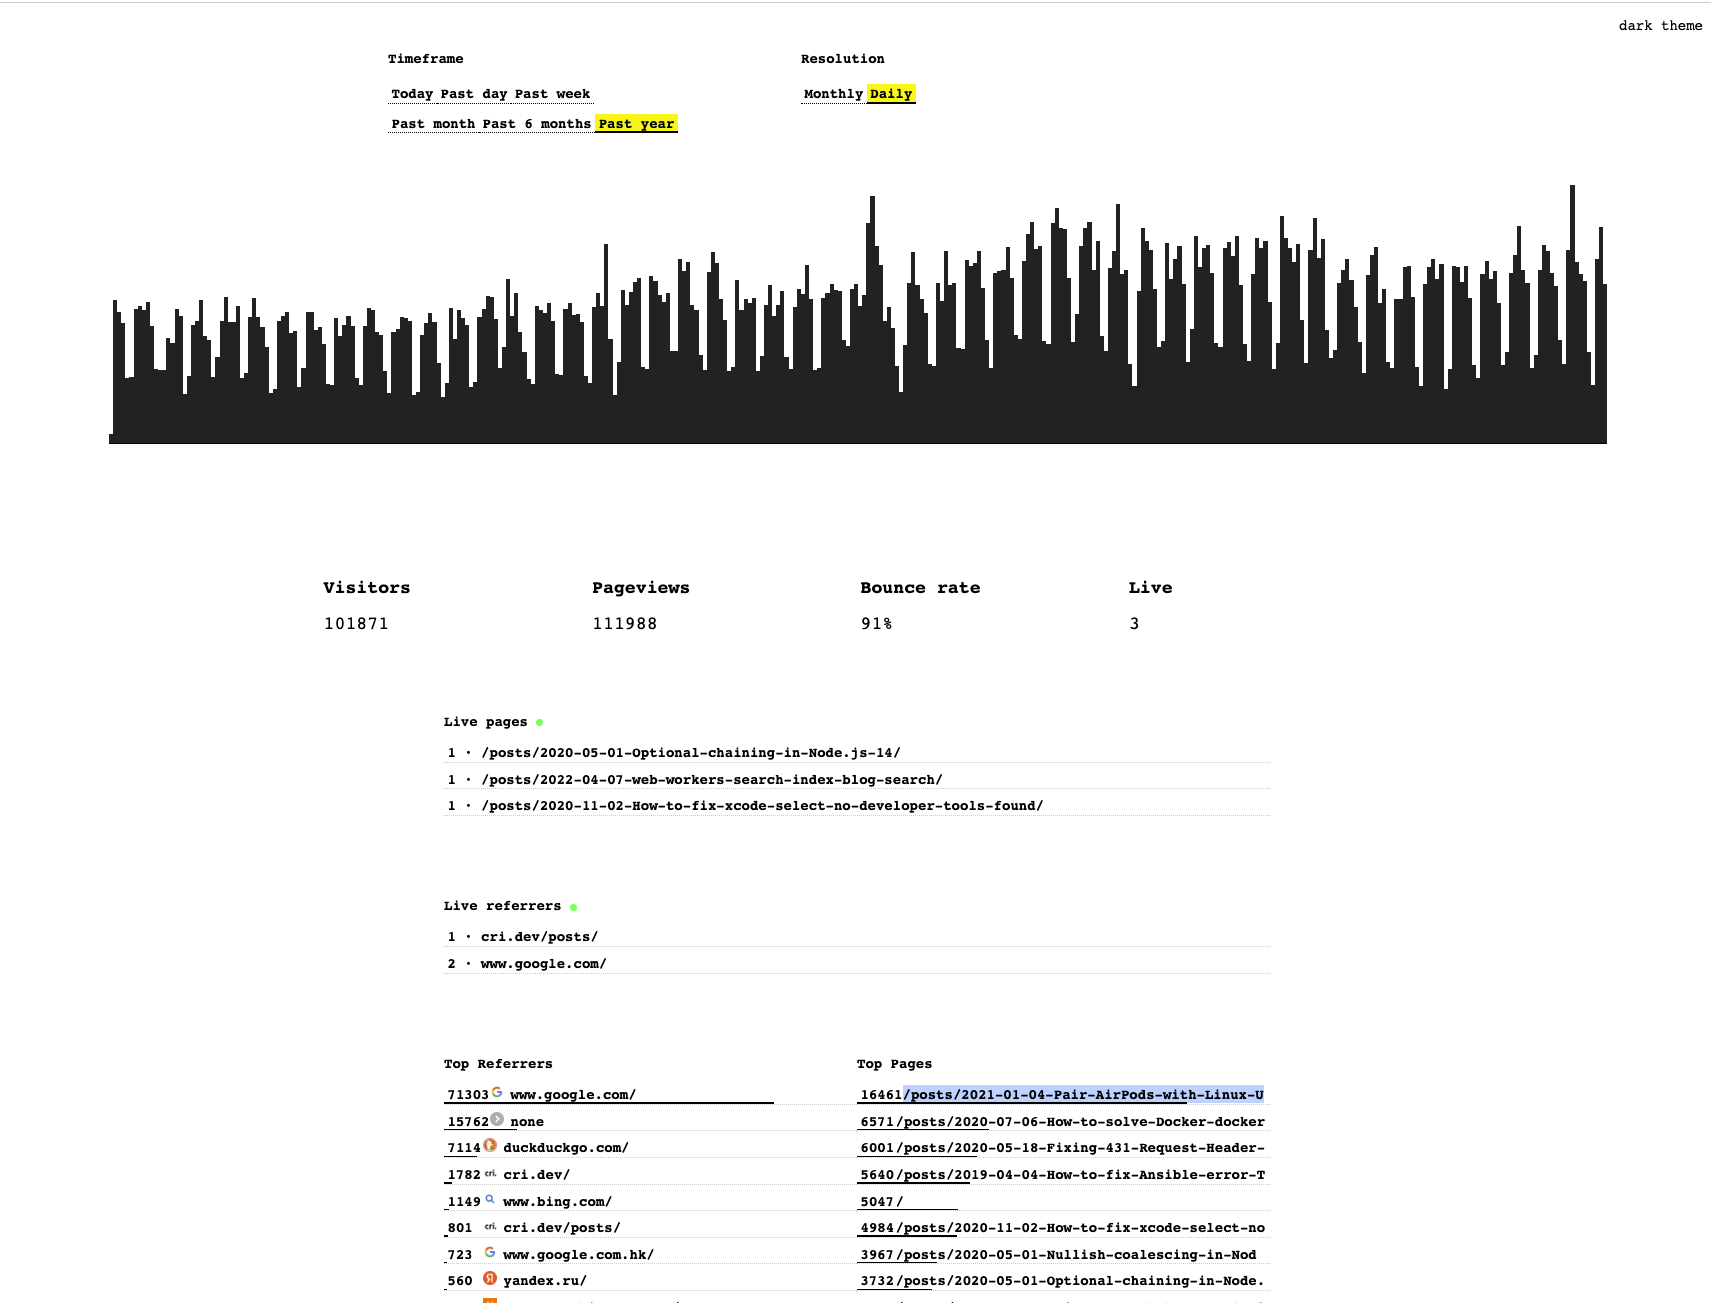
At the time of writing (2022-06-22), through minimal-analytics, I have tracked anonymously
- ~101k unique visitors
- ~111k unique page views
- over 71k visitors referred by google (over two thirds!)
without cookies too!
Why?
Good question.
First of all: I am a big fan of Plausible Analytics (no affiliation at all), from several point of views:
- Privacy oriented
- An excellent example of an Open-Source project, that MONETIZES!
- "Look, a cool new Elixir project! That's cleanly written too!"
- Great content marketing, lots to learn from them
Although I found a small hiccup.
Unfortunately, since Plausible is getting more recognition and thus included in blocker lists, your web analytics are quite a bit off.
I am doing an experiment by tracking pageviews on this website through
- Plausible (hosted, subscription)
- Umami (self-hosted)
- Minimal Analytics (self-hosted)
This to validate my hypothesis that I am getting ~30% less visitors reported (around 2-3k).
Why three web analytics software?
The hosted Plausible version to have a lower bound for the pageviews.
Umami since it is self-hosted and should catch every pageview (difficult to track and block, except if you disable all JavaScript).
Minimal Analytics to verify that I'm getting close to the pageviews tracked by Umami.
Finally I should be able to determine how many users "I am missing out of" in my Web analytics.
Experiments with persistence
I was telling myself "JavaScript is fast enough" and "You probably don't even need SQLite".
I also wanted to experiment with a LJSON "database", persisted on file.
Data and persistence
The file database is only read at the beginning, then only used to append new data points.
Restoring the memory
I am reading the file and setting the program memory with:
memory = fs.readFileSync(options.DATA_PATH)
  .toString('utf-8')
  .split('\n')
  .filter(Boolean)
  .map(l => JSON.parse(l))
  .filter(({ d }) => +new Date(d) > (+new Date() - 1000 * 60 * 60 * 24 * 180))
After reading from file, only the variable memory is used. It contains the data points of the last six months. As you can see this is easily configurable.
Adding a new data point
To add a new data point, simply appending to the LJSON file:
fs.appendFile(options.DATA_PATH, JSON.stringify(pageview) + '\n', (err) => {
  if (err) console.error('failed to persist pageview', err)
})
HTTP server
The HTTP server is built on top of the native http module.
It takes care of
- CORS for configured domain (through
process.env.SITE_BASE_URL) - Simple bot detection
- Tracking visitors to the site
- Serving the dashboard
- API for the dashboard
- Serving the client tracker script
Dashboard
The dashboard is built on top of preact, using the create-preact-app CLI.
Component tests with enzyme.
Every 15 seconds the Live visitors are updated, and every minute the whole analytics for the currently selected filters.
The dashboard consists of a single route.
preact-router comes in handy for handling navigation changes and setting the query parameters for the current filters.
I also experimented with chart.css to show the pageviews chart, and I must say it was a pleasant experience.
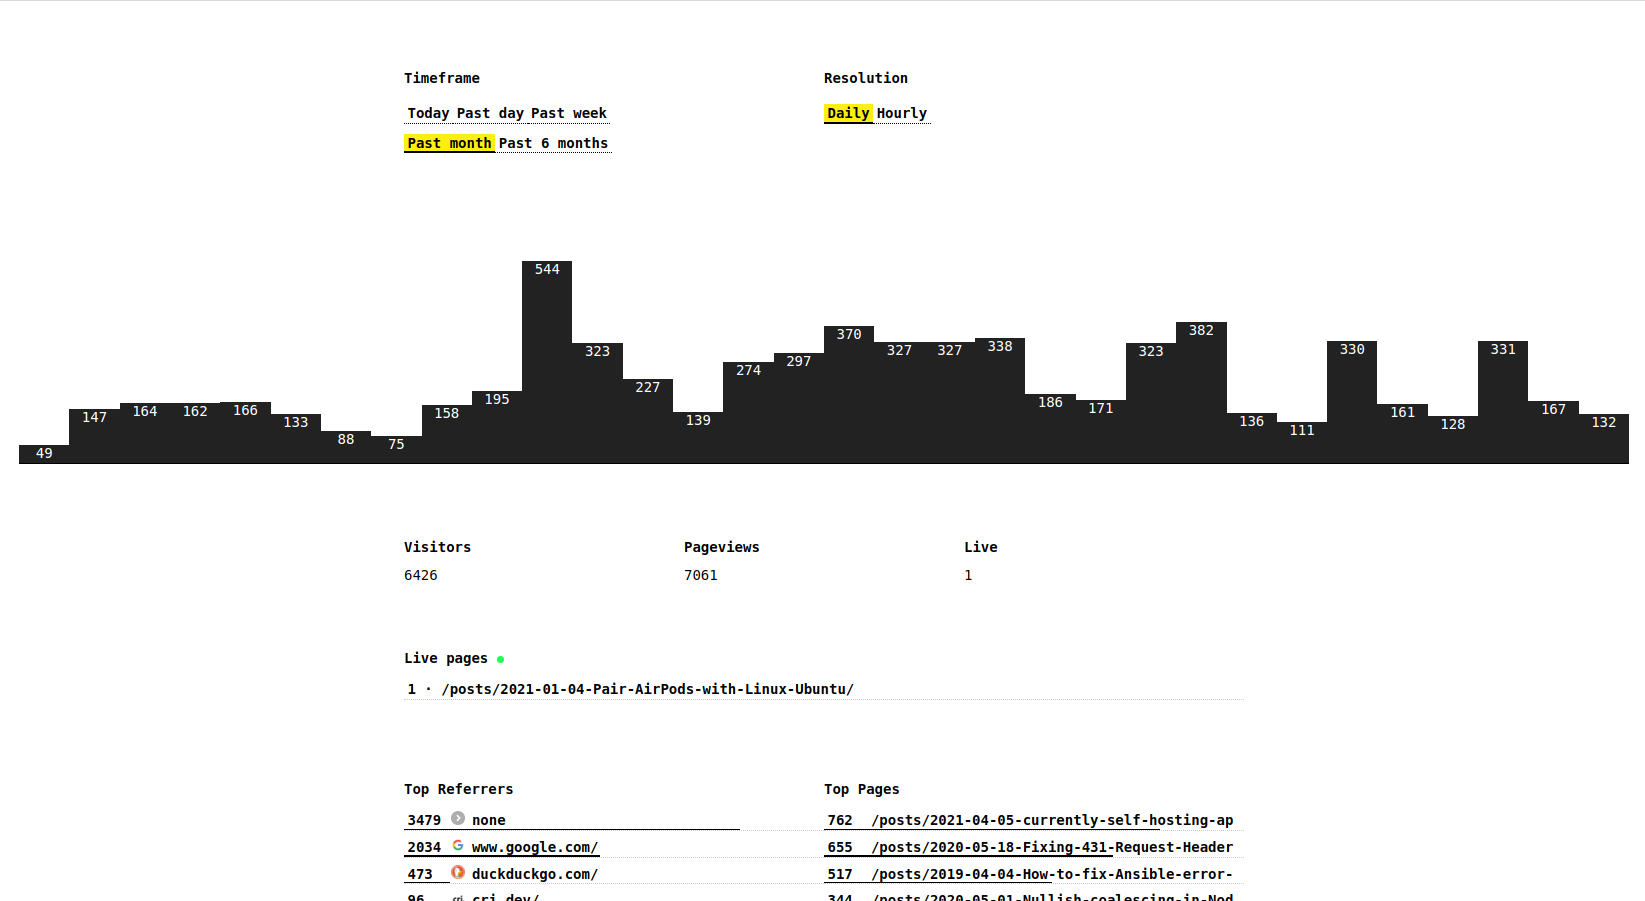
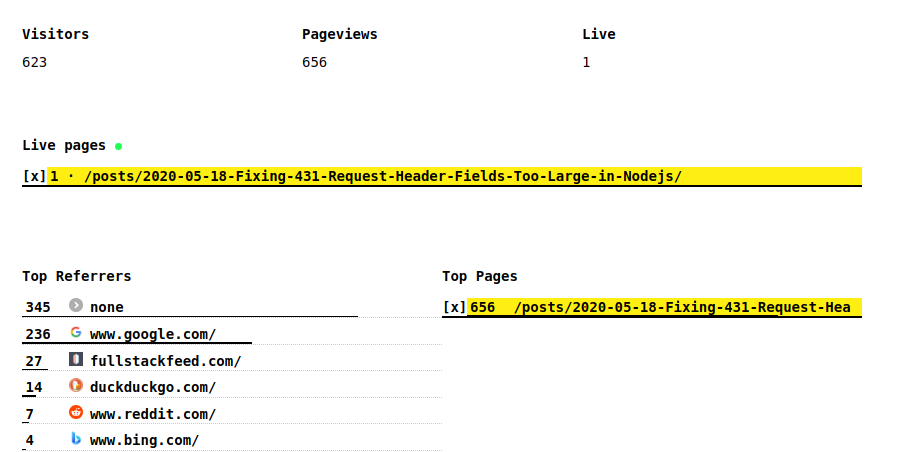
This is what the dashboard looks like now:
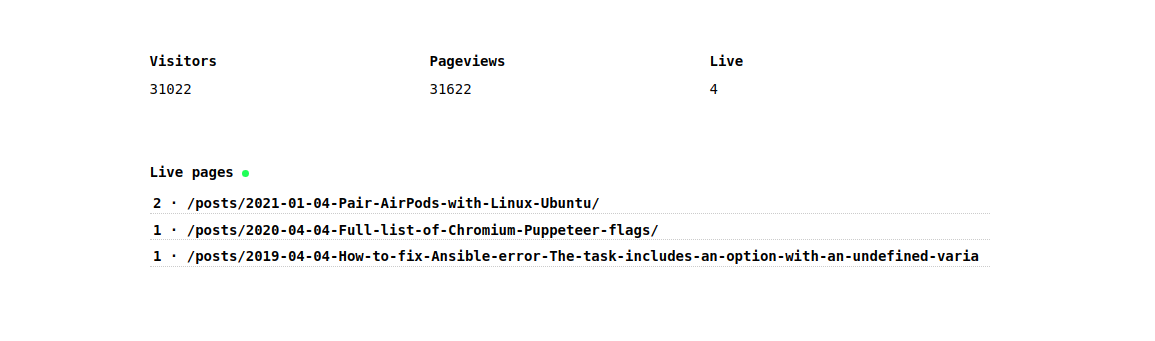
Live visitors
Each visitor get an ID, without cookies, that is essentially calculated using SHA256 and a random seed that changes every day:
createHash('sha256').update(remoteIp + userAgent + seed).copy().digest('hex').substring(0, 10)
On the frontend, the visitors are aggregated by page:
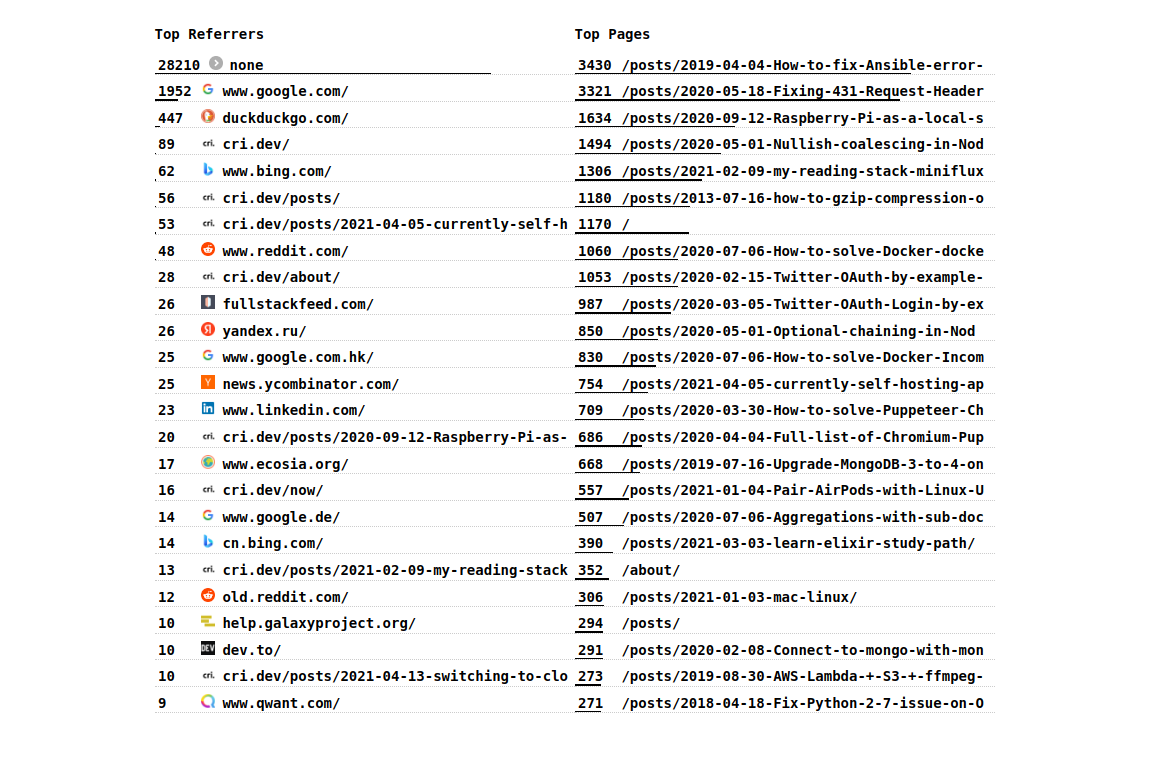
Top referrers and pages
The Top performing referrers and pages are displayed like this
Filtering
Every item on the page (except for the chart, I'm working on it) is filterable:
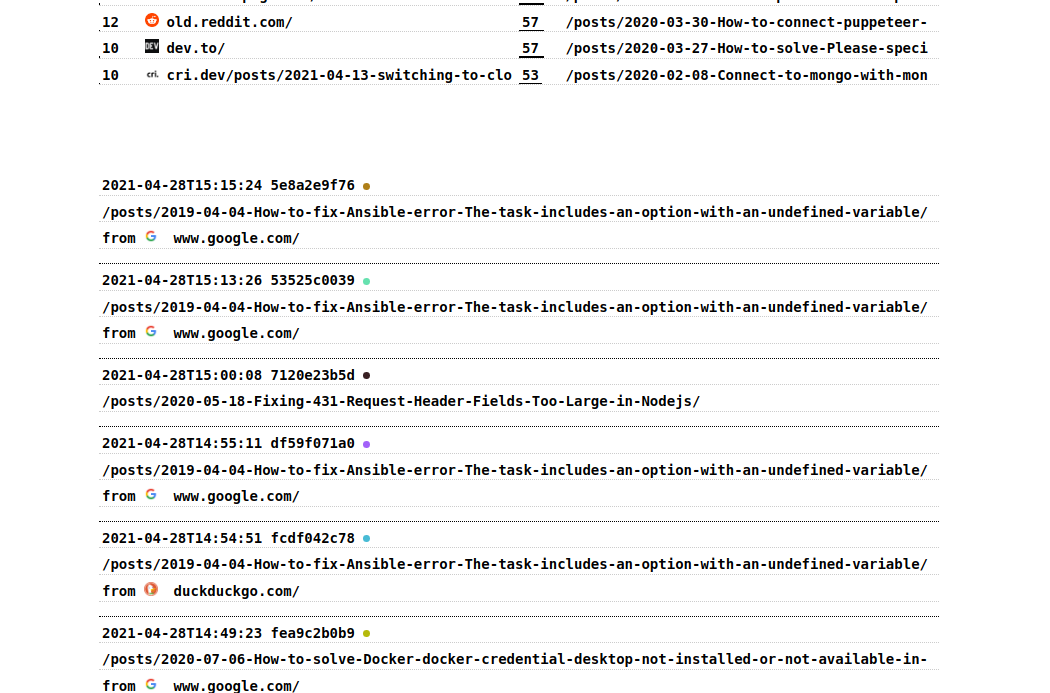
Pageviews history
The last 25 pageviews are shown, so that you can see recent activity on the website:
Client tracker script
It's simply included as a <script> tag, with async and deffered to signal it's low priority to the browser.
<script async defer src="https://s.your.domain.com/client.js"></script>
Once downloaded, the JavaScript in the client script makes a GET request to /p to track a pageview.
Every 10 seconds it sends a heartbeat, to check if the client is still connected and viewing the webpage.
The information collected are the following
{
  r: document.referrer,
  p: window.location.pathname,
  w: window.innerWidth
}
That's it for the tracking on the client side.
Privacy-friendly
Each visitor to this blog gets assigned a hash.
The hash is an encoded representation of the IP address, user-agent and a seed that changes each day.
This all without the use of cookies or any storage at all.
Below is the current implementation and its tests
const { createHash } = require('crypto')

module.exports = function visitorFromRequest (req, seed = new Date().getUTCDate()) {
  const userAgent = req.headers['user-agent']
  const remoteIp = req.headers['x-forwarded-for'] ||
    req.connection.remoteAddress ||
    req.socket.remoteAddress ||
    (req.connection.socket ? req.connection.socket.remoteAddress : null)
  return createHash('sha256').update(remoteIp + userAgent + seed).copy().digest('hex').substring(0, 10)
}
This will return a 10 character long identifier for each website visitor.
This comes in handy when differentiating pageviews from visitors, and so the bounce rate.
Additionally, this is useful when viewing the history of a single visitors.
This enables tracing the "path" the user took when navigating the site.
Simulated data from Plausible
Wrote a little scraper that for every page in my sitemap.xml, makes a request to the Plausible API and get the pageview for a given date.
This way I was able to approximately "reconstruct" pageview (without referrer information unfortunately) prior to April.
I started tracking data with Minimal Analytics since April 12th 2021.
All previous data is scraped from Plausible.
GitHub repo
Join me and let me know what you think (perhaps even contribute directly!) on GitHub.
The project can be found at github.com/christian-fei/minimal-analytics
Future
As said above, this all started as an experiment, so the idea is to validate my assumptions and determine how many users of this blog have an AdBlocker installed or similar.
To be more consistent with the results of the other web analytics software, I will probably need to switch to XHR instead of using fetch.
I am also trying to optimize the calculation further, to be able to handle more datapoints and do the calculations in memory.
With my current data, around 70k data points (since August 2020), the calculations for the yearly analytics take 150ms.